We will discuss a Forex Trading Strategy that is simple and basic yet works very well. There are many forex trading strategies selling for more than $2K but after you read this,you will appreciate the simplicity and beauty of this Forex Trading Strategy and the results that it produces. This Forex Trading Strategy uses EMA8 and EMA34 along with the Stochastic and MACD oscillators. You can use this strategy on H4 as well as D1 timeframes. Let’s discuss two GBP/USD live trade examples with this strategy on D1 timeframe.

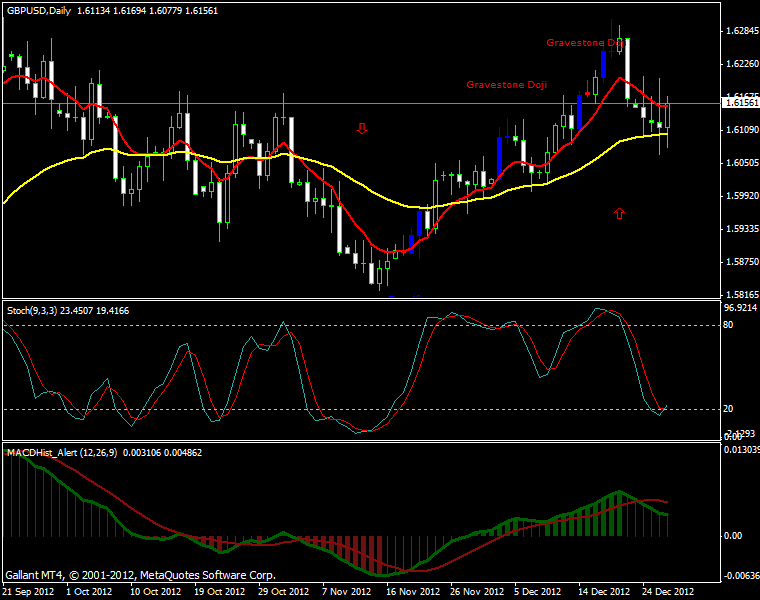
In the above GBP/USD daily timeframe screenshot you should look below the down red arrow, it is 13th November and GBP/USD is in a downtrend. EMA8 (red) is below EMA34 (yellow) indicating a downtrend. Stochastic oscillator is oversold and below 20 while MACD histogram is making longer lower bars and the signal line is above the histogram line indicating a downtrend. Looking at the stochastic oscillator, we can predict that it will move from the oversold to the overbought condition in the next few week. The stochastic oscillator is telling that price reversal is in the offing.
How are we going the predict the price reversal? We will use MACD oscillator in identifying the price reversal. When the MACD histogram is going to make shorter lower bars and the signal line crosses below the histogram line, this will be an indication that the price has changed direction and will now be moving up. This is precisely what happened on 19th November, when MACD signal line went below the histogram line indicating the start of an uptrend. You should also observe the formation of three bullish candles in a row on the D1 timeframe indicating that the price has indeed reversed. The price found the support at 1.58249 level. Suppose we had $1K in the account.We will enter into a long trade at 1.5860 with 0.1 lot. The stop loss was placed at 1.58249. The risk is 3.4% which is quite acceptable. If the stop loss is hit, we will lose $34. We will stay in the trade as long as the MACD signal line is below the histogram line or the fast stochastic is above the slow stochastic and as long as EMA8 (red) is above EMA34 (yellow).
On 19th December, a pinbar was made with a long upper wick and a very small body. Stochastic is also in the overbought region now with the MACD histogram making lower bars now. This is an indication that price has found the resistance at the level 1.6306. So the trade was closed on 20th December at 1.6200 making a total of 340 pips and a profit of $340.The return made during 30 days was 34%. During this one month, the trade did not take more than 20 minutes to monitor daily.
This was the conservative approach. A new trader should take this conservative approach with this system. But since I have been trading with this strategy for a long time. I am more confident about it and know when to get in and when to get out, I traded with 0.4 lots and made a profit of $1360 and a return of 136% in one month. Read more GBP/USD live trading examples of this forex trading strategy on H4 timeframe posted on my blog:
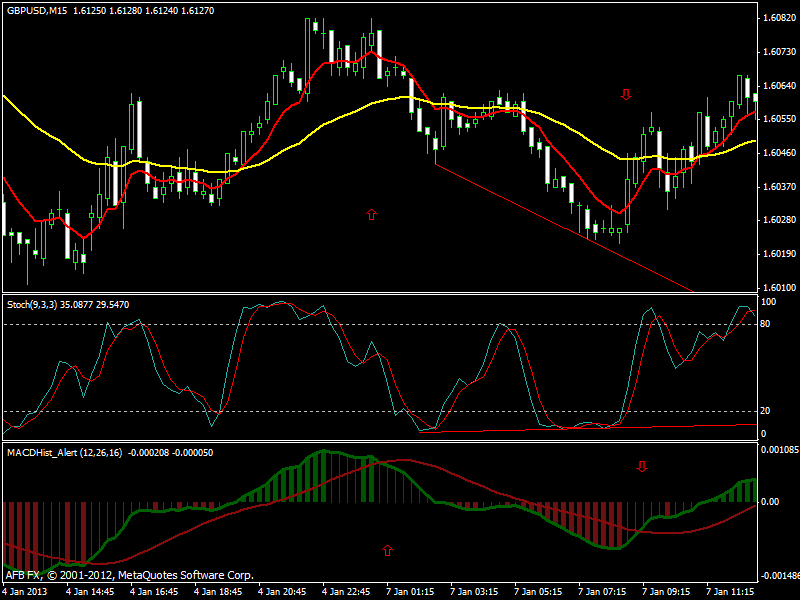
More screenshots:


