To fully understand this system, there are key assumptions that must be taken into account because that the system is generic.
Key assumptions:
Although the market is now functional 24hrs of the day, key trading hours for each session is about 7.5hrs as shown below:
- Frankfurt : 7am – 3.30pm
- London : 8am – 4.30pm
- New York: 2.30pm – 9:15pm
- Tokyo: 12:45am – 6:30am
- Note that these times are all based on UK time and are when active/live trading takes place, you can of course place trades out of these hours trading but non-forex instruments will attract a premium so i.e. higher spread.
- Lunch periods are periods of trading lethargy, therefore 1 hour is subtracted from the total active hours of each session
Instruments traded
• £/$
• €/$
• German Dax -30
• Japan (Nikkei) -225
• DJIA (Dow)
• US Crude
• Gold & Silver - I used it in the last 3 months or so for these instruments and it worked well
Indicators:
• 10 EMA
• 35 EMA
• 135 EMA
The user of the system is familiar with candlesticks patterns
TRADE SETUP:
Three EMAs are used to mimic the fan principle and in an uptrend, prices are expected to hang on to the 10 EMA and to depart far away from it in very strong trends but retrace to it at some point.
The time frame used is the 4hour chart. Horizontal support and resistance points are drawn on the daily chart and trendlines on the weekly chart. Entries and exits are made on the 30min TF Pending orders based on Fibonacci retracements for entries and a predefined level for exits
can also be used. Two orders are placed; one at 61.8% level and the second at 50%.
As previously mentioned, the EMAs are chosen to get certain results which are explained below:
On the weekly chart:
10 EMA – Prices applied to last 10 trading weeks (approx. 3 months)
35 EMA – Prices applied to last 35 trading weeks (approx. 9 months)
135 EMA – Prices applied to last 135 trading weeks (approx. 34 months)
• Note how the EMAs are related by a factor of approximately 3, I know it’s not exact but trial & error shows that these settings work best for my purposes.
On the daily chart:
10 EMA – Prices applied to last 10 trading days (2 weeks or half month)
35 EMA – Prices applied to last 35 trading days (7 weeks or 2 months)
135 EMA – Prices applied to last 135 trading days (27 weeks or 7months)
• This time, the EMAs’ price actions are related by a factor of four, each should act as a very good dynamic resistance and support on the chart.
On the 4hourtime frame:
10 EMA – Prices applied to last 40hrs (effectively 5 days based on 7.5hr per trading day/session)
35 EMA – Prices applied to last 140 hours (19 days or 1 month)
135 EMA – Prices applied to last 520 hours (72 days or 4 months)
• Again the EMAs’ price actions are related by a factor of four
THE SYSTEM TRADE SET-UP
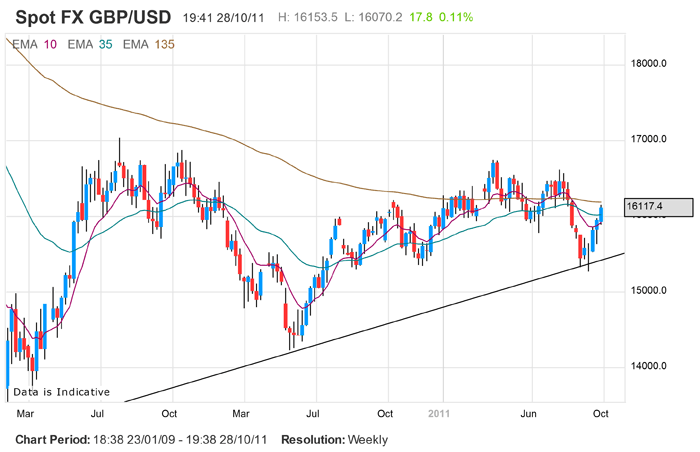
Starting with the weekly chart as shown, we draw our trend lines and also use this screen to determine what direction trade will be taken. This is the weekly chart of the £/$


The last candle shown on this chart is for the week beginning the 24th Oct (where arrow is pointing), the candle prior to the last one clearly shows that the £ is bullish so we will be looking for longs, i.e. we have identified the direction of our trades from the long term chart. If you look at this chart properly, you’ll see that you can draw an ascending triangle on this chart – a bullish pattern.
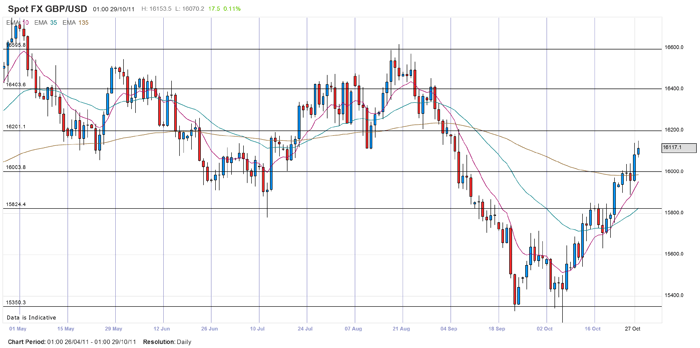
On to the daily chart now with our horizontal support and resistances drawn:


The double arrow shows that the trading days from 24 – 28 Oct, now if you had not looked at the weekly chart, you might make the decision to go short since the candle 24th was a doji, and it was followed by a spinning top. The inspection of the weekly chart makes of aware that the spinning top is potentially a pause and the rally to upside could be to continue. For those who would prefer to trade strictly on daily charts, you’d have entered at the close of 23 0r 24 daily candles around 15950 area with about 70 pips SL and TP to 16200 (you’d be risking 70pips for 250 pips – a very good risk reward indeed) For the trader who prefers the 4H TF, you’d potentially have a better entry and therefore a better risk reward ratio:


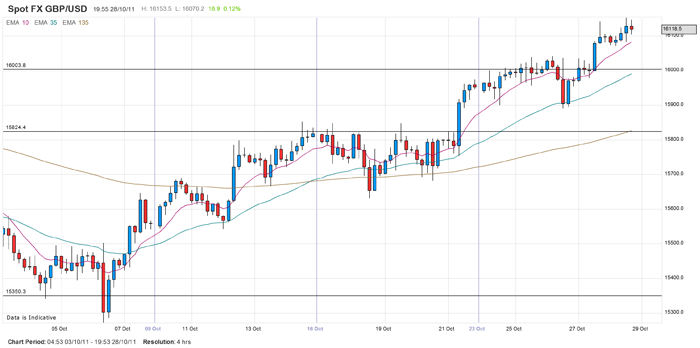
Recall that I said previously that your EMAs act as dynamic support and resistance, you’ll see that candle that the arrow is pointing at, clearly broke and close below the 10 EMA, so we’ll expect the a little more downside move. The next candle however, sat nicely on the 35 and I’d place my long trade here. In this case I use a rule of thumb of 50 pips as my SL and same TP as before, note the better entry at 15900, giving a risk reward of 6:1 (fabulous indeed) and this is why I prefer the 4H TF entries. If you are the more conservative trader, you may choose to wait for a bullish signal before you enter.
This system can be applied to the day trading as well as follows:
• Select your preferred trading time frame
• Multiply this TF by a factor of 5 ( this is where you draw your horizontal support and resistances)
• Multiply the second TF by factor of 5 to get your long term trend.
For example if your preference is the 1hr chart, your support and resistance would be drawn on the 4hr chart since a 5 hr chart is not the norm and your trendlines will be drawn on the daily chart.
Key assumptions:
Although the market is now functional 24hrs of the day, key trading hours for each session is about 7.5hrs as shown below:
- Frankfurt : 7am – 3.30pm
- London : 8am – 4.30pm
- New York: 2.30pm – 9:15pm
- Tokyo: 12:45am – 6:30am
- Note that these times are all based on UK time and are when active/live trading takes place, you can of course place trades out of these hours trading but non-forex instruments will attract a premium so i.e. higher spread.
- Lunch periods are periods of trading lethargy, therefore 1 hour is subtracted from the total active hours of each session
Instruments traded
• £/$
• €/$
• German Dax -30
• Japan (Nikkei) -225
• DJIA (Dow)
• US Crude
• Gold & Silver - I used it in the last 3 months or so for these instruments and it worked well
Indicators:
• 10 EMA
• 35 EMA
• 135 EMA
The user of the system is familiar with candlesticks patterns
TRADE SETUP:
Three EMAs are used to mimic the fan principle and in an uptrend, prices are expected to hang on to the 10 EMA and to depart far away from it in very strong trends but retrace to it at some point.
The time frame used is the 4hour chart. Horizontal support and resistance points are drawn on the daily chart and trendlines on the weekly chart. Entries and exits are made on the 30min TF Pending orders based on Fibonacci retracements for entries and a predefined level for exits
can also be used. Two orders are placed; one at 61.8% level and the second at 50%.
As previously mentioned, the EMAs are chosen to get certain results which are explained below:
On the weekly chart:
10 EMA – Prices applied to last 10 trading weeks (approx. 3 months)
35 EMA – Prices applied to last 35 trading weeks (approx. 9 months)
135 EMA – Prices applied to last 135 trading weeks (approx. 34 months)
• Note how the EMAs are related by a factor of approximately 3, I know it’s not exact but trial & error shows that these settings work best for my purposes.
On the daily chart:
10 EMA – Prices applied to last 10 trading days (2 weeks or half month)
35 EMA – Prices applied to last 35 trading days (7 weeks or 2 months)
135 EMA – Prices applied to last 135 trading days (27 weeks or 7months)
• This time, the EMAs’ price actions are related by a factor of four, each should act as a very good dynamic resistance and support on the chart.
On the 4hourtime frame:
10 EMA – Prices applied to last 40hrs (effectively 5 days based on 7.5hr per trading day/session)
35 EMA – Prices applied to last 140 hours (19 days or 1 month)
135 EMA – Prices applied to last 520 hours (72 days or 4 months)
• Again the EMAs’ price actions are related by a factor of four
THE SYSTEM TRADE SET-UP
Starting with the weekly chart as shown, we draw our trend lines and also use this screen to determine what direction trade will be taken. This is the weekly chart of the £/$


The last candle shown on this chart is for the week beginning the 24th Oct (where arrow is pointing), the candle prior to the last one clearly shows that the £ is bullish so we will be looking for longs, i.e. we have identified the direction of our trades from the long term chart. If you look at this chart properly, you’ll see that you can draw an ascending triangle on this chart – a bullish pattern.
On to the daily chart now with our horizontal support and resistances drawn:


The double arrow shows that the trading days from 24 – 28 Oct, now if you had not looked at the weekly chart, you might make the decision to go short since the candle 24th was a doji, and it was followed by a spinning top. The inspection of the weekly chart makes of aware that the spinning top is potentially a pause and the rally to upside could be to continue. For those who would prefer to trade strictly on daily charts, you’d have entered at the close of 23 0r 24 daily candles around 15950 area with about 70 pips SL and TP to 16200 (you’d be risking 70pips for 250 pips – a very good risk reward indeed) For the trader who prefers the 4H TF, you’d potentially have a better entry and therefore a better risk reward ratio:


Recall that I said previously that your EMAs act as dynamic support and resistance, you’ll see that candle that the arrow is pointing at, clearly broke and close below the 10 EMA, so we’ll expect the a little more downside move. The next candle however, sat nicely on the 35 and I’d place my long trade here. In this case I use a rule of thumb of 50 pips as my SL and same TP as before, note the better entry at 15900, giving a risk reward of 6:1 (fabulous indeed) and this is why I prefer the 4H TF entries. If you are the more conservative trader, you may choose to wait for a bullish signal before you enter.
This system can be applied to the day trading as well as follows:
• Select your preferred trading time frame
• Multiply this TF by a factor of 5 ( this is where you draw your horizontal support and resistances)
• Multiply the second TF by factor of 5 to get your long term trend.
For example if your preference is the 1hr chart, your support and resistance would be drawn on the 4hr chart since a 5 hr chart is not the norm and your trendlines will be drawn on the daily chart.